On March 1st, my friend and colleague, Marissa Carter, PhD emailed me a graph of her COVID-19 infection rate model. After seeing it, I put my mother in quarantine the following week. Her model turned out to be far more accurate than the Harvard model (or other models) – so when she sends me an email with permission to share it, you can bet it’s worth reading.
–Caroline
What Happens Next for the USA?
While there are a great many more blogs to write about COVID-10 from my perspective, before we go any further, we need to have an in-depth discussion on the epidemiology of the virus, so some things that weren’t clear to you now will be, especially as we are going to incorporate many of these items in further discussion.
COVID-19 and Death
Some people who get infected with COVID-19 die. That’s a pretty simple concept, right? It should just be another statistic. But, not so fast! First, we have to figure out if someone really died from the virus, and we then have to officially record the cause of death. Figuring that out (immediate cause of death, sometimes intermediate cause of death and underlying causes of death) is not so easy, especially when the medical records aren’t available, and testing may be lacking.
Consider the following cases:
- A woman who has tested positive for COVID-19 has a myocardial infarction in the ICU and dies despite best efforts. Did she die of the virus? In other words, is COVID-19 the immediate cause of death? No, her MI was. The virus could have been a contributory cause because we know the virus can infect the heart, but we don’t know for sure.
- A patient admitted to the ICU during the pandemic dies of Adult Respiratory Distress Syndrome (ARDS) but was not tested for COVID-19. However, Coronavirus might have been the immediate cause of death. While legally these decisions are made by a coroner, when there is insufficient or conflicting information and differing state rules with regard to counting COVID-19-related deaths, the results can be misleading.
- A person with advanced lung cancer can’t get her treatments because of what’s going on in her healthcare system, and she dies. Is her death related to the Coronavirus? Yes, obviously, but it won’t show up on her death certificate.
There is political pressure on both sides of the death attribution issue. If your state has a mandate to count all deaths that are in any way related to the virus, that can skew the data just as much as a directive to NOT count all deaths (because it looks bad for the state). Both of these approaches exist in various states. This why the death numbers should be treated as fuzzy numbers, and also why comparisons between countries or even within states are not always helpful.
Mortality Rates
The mortality rate (MR) for the virus is calculated as the number of deaths that occur in the total at-risk population over a specific period of time (e.g. the “flu season” is one year). The MR is the probability of an individual dying within a specific population over a given time period. The crude case fatality ratio (CFR) uses the same numerator (death) divided by the number of confirmed cases (by testing). The CFR assumes no false positive or false negative tests. In theory, one could adjust the CFR to account for inaccuracies in testing, but it’s challenging to do so.
The Infection Fatality Rate (IFR) is death divided by the number of people who have been infected with COVID-19. That’s a tough number to determine for COVID-19, because we’ll never know the number infected with any accuracy for 3 reasons:
- We would have to test a very large sample of the population (think: millions) for antibodies to the virus;
- We would have to assume that anyone who was infected actually produced antibodies;
- We don’t know if that’s true; and (3) the sensitivity and specificity of many antibody tests is not the great.
Another reason why comparing any kind of mortality statistic between populations is tough is that to look at “apples to apples,” one has to adjust for age and gender (so-called age- and sex-adjusted mortality rates). Older, more male-dominant populations are quite different from younger, gender-balanced populations.
My estimate of the IFR is 0.28 to 0.42 (with a 95% confidence interval). This is a lot less than 2%, and we’ll discuss the reason for that as part of another blog.
Infection Prevalence and Herd Immunity
We talked about the true infection prevalence in a previous blog, but it’s going to be a couple more months before we get some decent state-based data that will tell us, based on antibody testing, what the likely national prevalence of infection is. Herd immunity for this virus has been extensively discussed, with values anywhere from 60-80%. However, we definitely won’t reach that number this year and probably not the next either.
Projections for Infection Trends for 2020
Because we don’t really know true infection prevalence, I’m going to use the data for confirmed cases, even though the number of confirmed cases is much smaller than the true number of cases out there. There have been dozens of projection models published and I think most of them are dead wrong, for reasons I’ll shortly discuss.
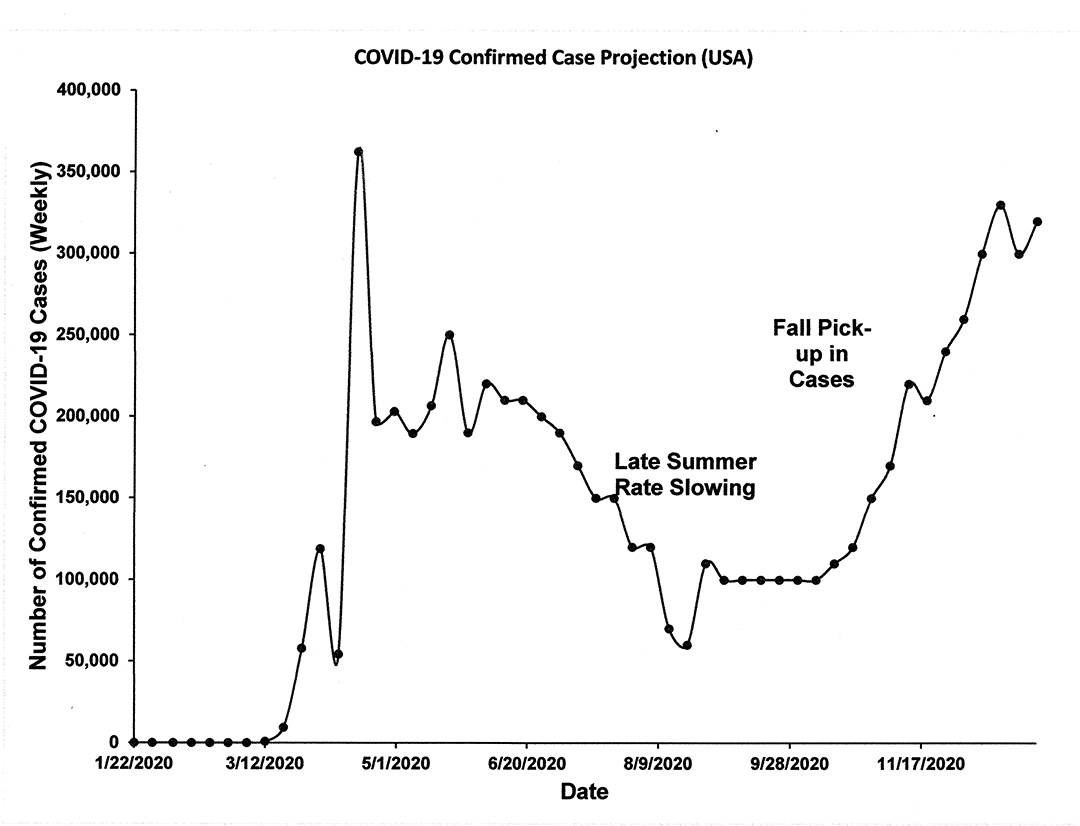
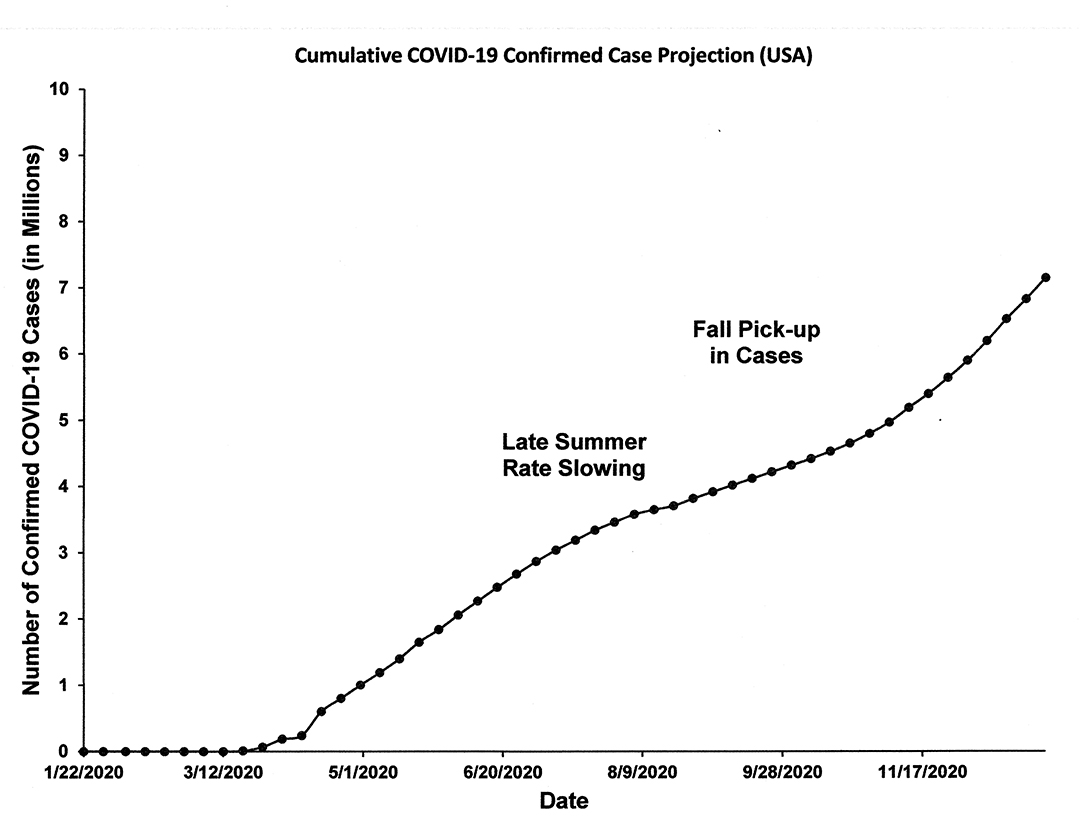
In Figure 1 below, I show my projection of weekly confirmed cases for the rest of the 2020 year, which is based on a smoothed trend approach combined with a random element to give it some realism. Figure 2 shows the same data but in cumulative cases format.
This model shows:
- Real data through May 11.
- A period of about 6 weeks in which there won’t be any serious change to the numbers.
- A period of steadily decreasing weekly case numbers from mid to late summer through to mid Fall, when they pick up with a vengeance.
Assumptions:
- The progressive opening up of states around the country isn’t going to help infection rates go down, and they could even go up for several weeks.
- We do expect the climate (meaning summer) to give us a break of about 20-30% decrease in infections, but you won’t see this until we have stabilized first.
- The majority of people will largely respect social distancing and avoid larger gatherings and wear masks for several months BUT by fall will be getting really tired of it, and compliance will seriously deteriorate by September (we’ll explore the reasons why in a future blog).
- The above assumption, plus the colder weather, drives the infection rate back up by late fall.
Final Thoughts:
- COVID-19 is not going away this year: Anyone who is magically expecting this virus to go away this year needs a reality check.
- Infection vs. Economic Disaster: I expect as time goes on we will see increasing trade-offs- allowing more infection as opposed to “lockdowns” because of the dire economic situation.
- Acceptance of COVID-related deaths: Society will learn to accept COVID-related deaths – because humans adapt to things.
- Travel (especially international travel) will not rebound quickly.
- Increased focus on mental health: It is likely that the focus will change from COVID-19 treatment to dealing with the massive social and mental health consequences the population will have experienced by the end of the year.
- No vaccine this year: There won’t be a “good to go” vaccine this year (and maybe not a useful vaccine until next year), but we’ll also explore that as another topic.
Marissa J Carter MA PhD MAPWCA
President
Strategic Solutions, Inc.
37 Voyager Lane, Bozeman, MT 59718, USA
Website: http://www.strategic-solutions-inc.com

Dr. Fife is a world renowned wound care physician dedicated to improving patient outcomes through quality driven care. Please visit my blog at CarolineFifeMD.com and my Youtube channel at https://www.youtube.com/c/carolinefifemd/videos
The opinions, comments, and content expressed or implied in my statements are solely my own and do not necessarily reflect the position or views of Intellicure or any of the boards on which I serve.


