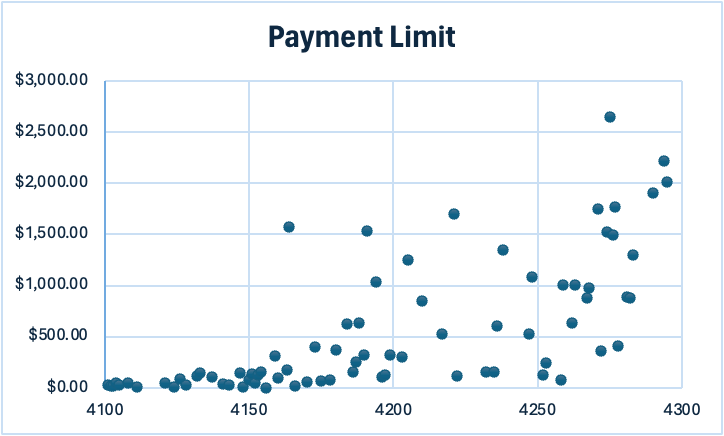
I’ve posted previous blogs detailing what I’ve learned about the impact of establishing the Average Sales Price (ASP) for products, and the perverse impact that an established ASP seems to have. Here’s a visual example of the insanity of pricing and the problem with ASPs. These data were provided by an expert who prefers to be anonymous, at least for the time being.
–Caroline
Dr. Fife,
CMS (with a gentle nudge from OIG) has been hard at work publishing ASPs. 17 CAMP (Cellular, Acellular, and Matrix-like Product) ASPs were published on the Q1 2022 list, while the recently released Q2 2024 list included 75. Unfortunately, CMS’s recent focus on publishing ASP rates does not appear to be having the intended effect – which is to reign in pricing. Instead it is clear from the data that skin sub prices keep going up and up. The chart below depicts the current ASP-based reimbursement or “payment limit” for a group of sequential Q codes from 4101 to 4295. The newer products have higher Q code numbers. The Y axis depicts the Q codes so that newer codes are represented on the right.
The X axis depicts the ASP payment limit per cm2 for Q2 2024 from CMS’s published list. A few of the newest codes are not yet published nationally by CMS, so their payment limit was obtained from the First Coast fee database. Based on CMS’s recent patterns, we would expect that these highly reimbursed products will have correspondingly high ASPs published in the next quarter or two.
Note how the ASP pricing of skin subs is continuing to increase as new Q codes are added. Although it’s true that there are a few expensive products with lower Q codes, and there are also some new products that are reasonably priced, the trend is unmistakable, Most of the products that cost more than $1,000/cm2 are in Q codes numbers higher than Q4200.
This means that the earliest products with the most clinical data are priced far less than the newer and more expensive products. The products that have just been launched are reaching truly astounding prices, now approaching $3000 per sq cm. Even worse, there seems to be no feedback mechanism to contain the price increases for new products. In fact, just the opposite. Since practitioners in the office-based setting can make higher profits on more expensive products, there’s a perverse incentive for clinicians to use the most expensive products and for manufacturers to secure higher and higher ASPs. There does not seem to be any way to stop this with the system as it is currently set up.
Even more concerning is the fact that there are no data to prove that the products on the right side of this graph (more expensive) are more effective by several orders of magnitude than the less expensive ones on the left. In other words, there’s no way to justify this pricing. Common sense says that these products cannot differ as much in terms of effectiveness as the price differences would suggest.
Thank you for letting me post this.
[Name withheld]
Additional Reading:
- More of Your Letters: Skin Substitutes, CMS, Failed Proposals and the Broken System
- How We Got Here – Answers to the Questions I Have Been Asking
- Taking a Closer Look at the OIG Report on “Skin substitute” (CTP) ASP Transparency
- “We Will All Lose in the End.” Let’s Discuss the Moral Hazard of the CTP (Skin Substitute) Industry
- A Problem Well-Stated is a Problem Half Solved… (Hopefully)

Dr. Fife is a world renowned wound care physician dedicated to improving patient outcomes through quality driven care. Please visit my blog at CarolineFifeMD.com and my Youtube channel at https://www.youtube.com/c/carolinefifemd/videos
The opinions, comments, and content expressed or implied in my statements are solely my own and do not necessarily reflect the position or views of Intellicure or any of the boards on which I serve.


