

This topic is like taking an Ambien in the middle of the day. Don’t read this article. I’m serious – watch some kittens on You Tube or read an article about what foods will make you lose weight. This topic will determine the future of the field of wound care, but like most things that are incredibly important, it’s hard to explain and requires effort to understand. GO BACK NOW. STOP READING.
If you are still reading, it just proves my point that no one listens to me.
On June 28th, Acumen held the first of a series of virtual meetings to create a Medicare “cost measure” for chronic ulcers. Here’s a link to the recording, but it is four hours long.
I am the one in the video who keeps raising a virtual hand and asking, “I am sorry but I still don’t understand…” Here’s what I think I DO understand. The Centers for Medicare and Medicaid Services (CMS) knows that wound care costs billions. They know that outcomes are highly variable, that some patients are very sick, and that there are HUGE variations in what Medicare spends on treatment. Based on exhaustive analyses which they’ve done for other medical conditions, they know that some of the money they spend is wasted. If they can get a handle on approximately how much the treatment of a chronic ulcer should cost (in relation to a patient’s risk factors), they could compare the “performance” of doctors who care for patients with wounds by looking at the Medicare charges for which they are responsible. (Yes, the words “podiatrists” and “skin substitutes” were mentioned…)
Acumen has put together a large group of clinical experts to review the data and try to identify the costs associated with the huge, messy bucket of “chronic non-pressure ulcers” – and that means it includes venous leg ulcers (VLUs), diabetic foot ulcers (DFUs), arterial ulcers, and “I hit my leg on the dishwasher door and it never healed” ulcers. They are aware of how many comorbid conditions our patients have. Excellent questions were asked. It is, in fact, a very good committee.
I am going to try to explain why we need this effort to go well.
We need this “cost measure” effort to go well because since about 2014, we’ve known that wound care practitioners were doomed to eventual extinction. In the gradual unveiling of the Quality Payment Program (QPP), CMS made it clear that “cost” was going to determine about a third of the method by which they reimburse doctors under traditional Medicare Fee for Service (MFFS). We have been doomed because: 1) we don’t have a medical specialty code, 2) our patients are expensive and 3) there are no “quality measures” that are relevant to wound management. It’s the asteroid that could wipe out our existence – at least as far as Medicare is concerned – but the private payers always follow along.
I am going to explain WHY we are a bunch of big, slow brontosaurs calmly chewing tree tops:
Medicare Spending per Beneficiary (MSPB) is one of the ways that CMS measures whether a given practitioner is providing more costly care than his/her peers. The calculation begins with a list of medical conditions and operations which CMS knows contribute significantly to healthcare spending. Until a few months ago, “chronic ulcers” was not on that list. However, when a patient was hospitalized for certain conditions, or had certain surgeries, or had certain diagnoses, it triggered a calculation of MSPB based on an “episode of care.” A lot of work went into determining what started and ended an episode. A lot of work went into determining what services went into an episode. Below is an example of ONE of these episodes.

In 2016, the episode list included hospitalization for myocardial infarction, congestive heart failure (CHF), urinary tract infections, exacerbation of chronic obstructive pulmonary disease (CODP), GI hemorrhage, ischemic stroke, and pneumonia. The cost of these episodes is adjusted for patient level of illness using the Hierarchical Classification Coding (HCC) score about which I have blogged about extensively:
- The HCC, The Terminator and Judgement Day for Wound Care
- Guest Blog by Helen Gelly, MD – What is a Hierarchical Condition (HCC) Score and why should you CARE?
- How to Find Your HCC Score
Which Practitioner is Responsible for the Costs?
With all the practitioners involved in the patient’s care during an episode, how does CMS decide who is responsible for the cost of the episode? For most episodes, the “responsible” clinician is the one who bills the most Evaluation and Management (E&M) visits during the episode. With the current committee, CMS is trying to decide how to identify the practitioner responsible for the costs of wound management. This is actually a good thing.
Because of the frequency of a patient’s outpatient visits for wound management, the DPM, MD, NP or PT seeing them is being held responsible for the costs associated with the patient’s heart failure, diabetes, stroke (or whatever else is wrong with the patient). Key Point: The entire cost of an episode of care for an underlying medical problem is currently being attributed to the wound care/hyperbaric practitioner. That’s a bad thing.
Depiction of Total Per Capita Cost (per provider)
After CMS calculates Medicare Spending Per Beneficiary (MSPG), it calculates a practitioner’s Total Per Capita Cost. This is the overall cost of care provided to each of the beneficiaries attributed to a specific doctor. In other words, patients have an episode of care, each episode is attributed to a specific doctor, and all that doctor’s episodes become the Total Per Capita Cost (TPCC). TPCC is risk adjusted based on the practitioner’s medical specialty. That’s another reason wound care practitioners are doomed.

Key Point: The attributed costs are compared to the aggregate of all the practitioners in that doctor’s same specialty, most of whom do not practice wound care. That’s why I look like a really BAD family practice doctor.
My Spendthrift Ways
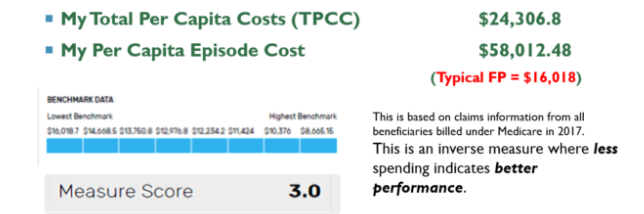
The figure below, taken from my 2018 MIPS report, depicts my Total Per Capita Cost and episode cost. As you can see, my episode cost was $58,000 whereas the average family practice doctor’s was about $16,000. As a wound care practitioner, my costs are much higher than the typical FP. They are so much higher that CMS gave me the worst possible (lowest) score in the “cost” category of MIPS (3 out of 10). Medicare looked at the price tag of my patients and said, “As a Family physician, she expends far too much of Medicare’s resources. She must be providing unnecessary care.” One of these days, CMS is going to insist that I pay some of that money back and there is a mechanism inside MIPS to enable that.
The table below is from my 2018 Quality and Resource Use Report (QRUR). You can see the “ambulatory care-sensitive conditions” that year included bacterial pneumonia, urinary tract infection, dehydration, diabetes complications, chronic obstructive pulmonary disease (COPD)/asthma, and heart failure. Remember that the cost of care in these patients was assigned to me because I saw the patient more often than their other doctors. I was incorrectly identified as the primary care physician, and worse, because I see patients so much sicker than the other doctors with my board certification, the per capita cost of my patients is out of alignment with the rest of my specialty.
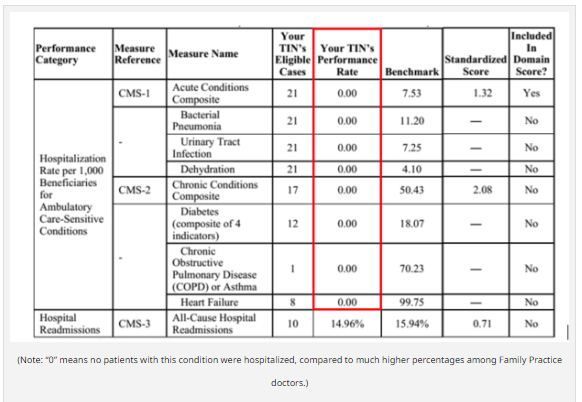
(Note: “0” means no patients with this condition were hospitalized, compared to much higher percentages among Family Practice doctors.)
The column labeled “your TIN’s Eligible Cases” are the patients with these conditions for whom I provided the plurality of services that year. I’d like to point out that I was only in clinic 2 days a week, but I still had 21 patients each with UTIs, dehydration, and pneumonia, even though I did not treat these conditions! I had 10 patients in the “all cause re-admission” category but since 20 patients are the threshold for a cost measures to matter, I didn’t experience any sort of penalty. What would have happened if I’d been practicing 5 days a week? I am sure I’d have gone over the re-admission threshold.
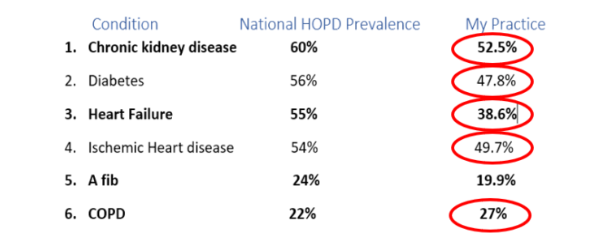
Why do my patients cost so much? I showed you the numbers in my MIPS “cost” category which concluded that I spend $58,000 per episode rather than $16,000, which is the average for a family practice doctor. Now look at the Medicare data regarding my Hierarchical Classification Code (HCC). More than half my patients have chronic kidney disease, half have ischemic heart disease, nearly half have diabetes, 38% have heart failure and more than a quarter have COPD. I have just listed the most expensive conditions for a Medicare beneficiary, and my patients always have at least one of them; most of my patients have two of them.
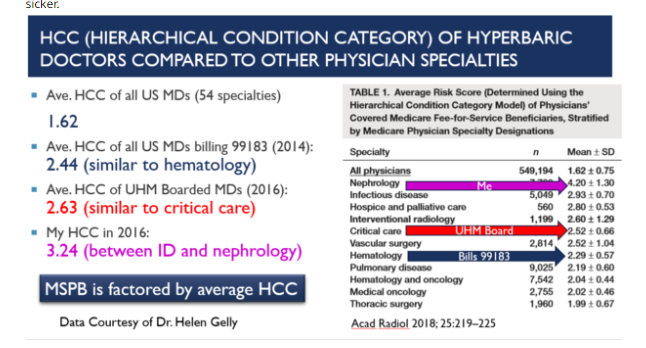
As a side note, practitioners tell me they see HCC scores > 6 internally computed by their hospital EHR. This is NOT your actual HCC score – you must get that from CMS. My actual HCC score is 3.24, which is about the same as a nephrologist. HCC data are publicly available. Nephrology has one of the highest scores at 4.2 + 1.3. It’s interesting to note that practitioners who are board certified in Undersea and Hyperbaric Medicine have higher HCC scores than the aggregate data of every doctor in the country who billed the code for chamber supervision (2.63 vs. 2.44). An HCC score of 2.63 is about the same as hematology. Remember that the higher a practitioner’s HCC score, the more CMS “understands” why the practitioner spends so much money to care for a patient – their patients are sicker.
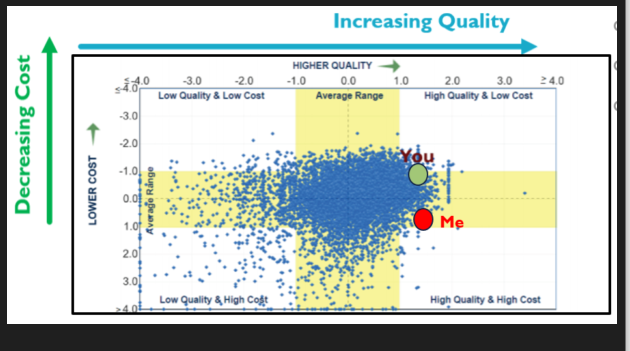
Every practitioner is being positioned on a grid in relation to the cost of care as described, and their quality score which is usually a score obtained from MIPS quality reporting. The ideal position on the grid is the top right corner. To CMS, that person delivers high quality care at low cost. Unfortunately, we do not report quality on the same patients who are represented in the cost of care calculations, nor do the quality measures we report provide insight into the care provided by that practitioner. (That by the way, is what the “MVPs” are intended to fix – more on that topic later).
Below is a scatterplot of all the family medicine physicians in the country. There are quite a few in the lower left quadrant that represents low quality and high cost. I in the lower right quadrant which represents high quality and high cost. I’m down there because the Medicare Spending Per Beneficiary (MSPB) of my patients is higher than those of other family practice doctors (the cost component). That is because they are MUCH sicker, based on the fact my HCC score is TWICE that of the average physician in the country. The severity of my patients is typical for a nephrologist, as are their costs. I may have a maximized my quality score by using the US Wound Registry (USWR) for quality reporting, but the best cost score cannot compensate for having a much greater MSPB if the comparison group are patients seen by family practice doctors.
Why does it matter if I am in the lower right quadrant instead of the upper right quadrant of the cost and quality grid? Why should I care? I care because it impacts how much I am paid for my services. A practitioner in the high quality, low cost tier can get an additional 2% of Medicare Part B payments for delivering “value.” When I contract my services with private payers, that “value” adjustment can be even higher, or worse, if I might not even be allowed to see patients with some private insurance because I am in a low value tier.
To summarize, we can’t go on the way we are with wound care doctors being held accountable for all the costs associated with the many comorbid diseases of wound care patients. Even if the current cost committee does a BAD job, we will be better off with a cost measure directed at chronic ulcers than being held accountable for the cost of heart failure – which affects nearly half of our patients.
Yes. This topic is incredibly boring. It’s also incredibly important.

Dr. Fife is a world renowned wound care physician dedicated to improving patient outcomes through quality driven care. Please visit my blog at CarolineFifeMD.com and my Youtube channel at https://www.youtube.com/c/carolinefifemd/videos
The opinions, comments, and content expressed or implied in my statements are solely my own and do not necessarily reflect the position or views of Intellicure or any of the boards on which I serve.